


Saturday Chart Fest

Good Saturday Morning Chart Fans!
We still have resistance overhead and support down below! I continue to watch the charts that have made it over the March high (few and far between) such as XLI and IGV. They also have resistance but have managed to chew through some of it.
For all of you head and shoulders fans (I am one!) who are looking for those h/s bottoms on the charts, be sure to look at the failed one in XLV from a few months ago. Doesn’t mean they won’t work this time but be on the alert.
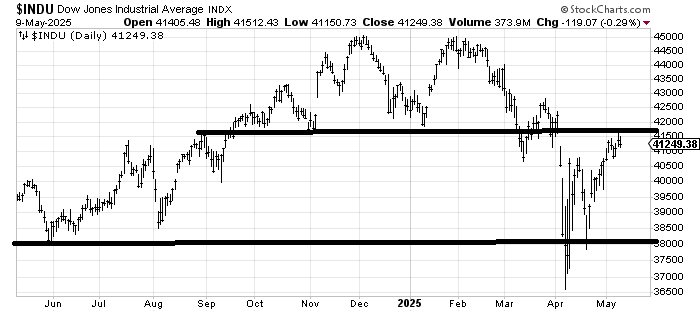
DJIA
Transports. Haven’t even made it to 14500 yet.

Utes. False break at the lows and now at the highs.

SPX. If it can get over 5700 might get folks giddy but 5800 is still there.

Naz.

IWM. Chewing through resistance but quite a slog.

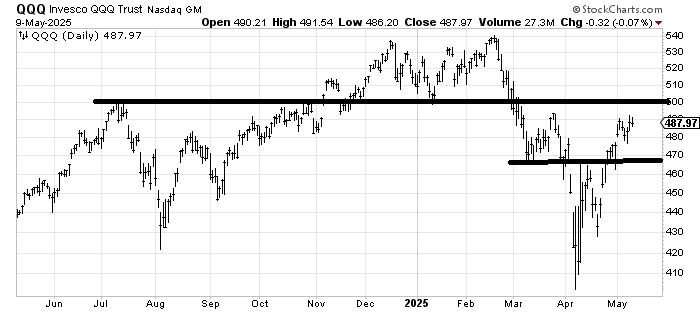
QQQ
QQQJ

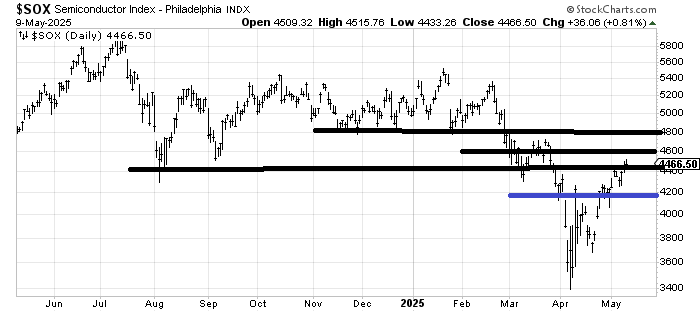
SOX. So many layers of resistance. If there is some giveback I think 4200 is key.
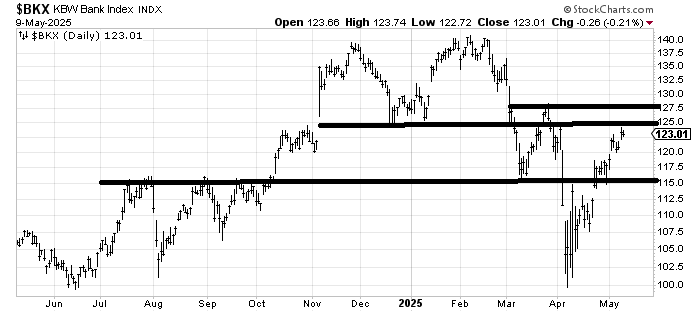
Bank Index.
IGV

XLI

XLE. Energy had some, well, energy this week.

OIH. Got over 220 but did it like it was going up a hill.

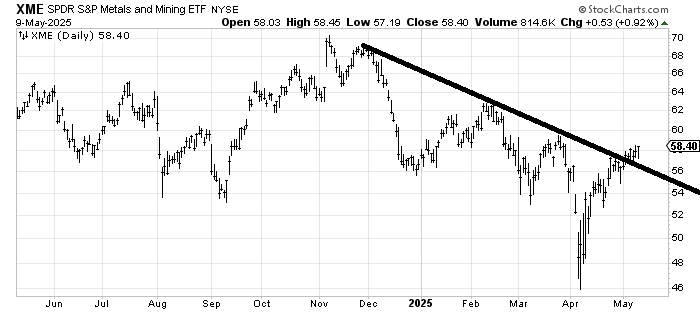
XME. Crossed the line but still a ton of resistance all the way up.
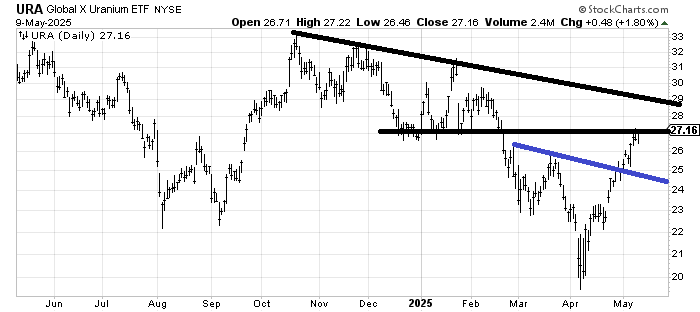
URA. Over the March high but into resistance.
XLV. The arrow shows the failed h/s bottom. Blue lines look like new range for now.

XLP. Home on the range.

XBI. Can it hold 75?

IYR.

ITB. Can’t even get to resistance at 95-97 thus far. That’s despite crossing that downtrend line.

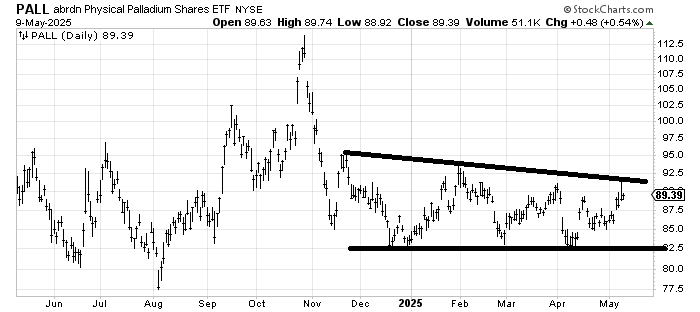
PALL. Keeps sucking me in.
LIT

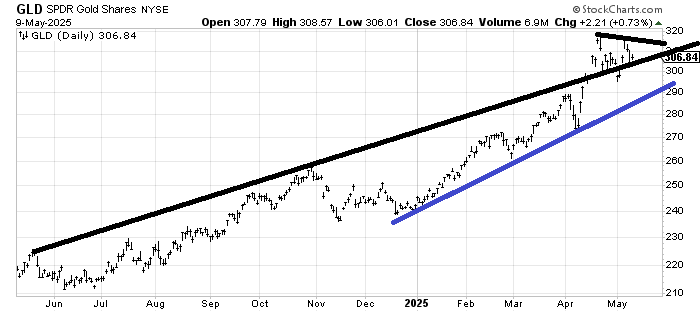
GLD.
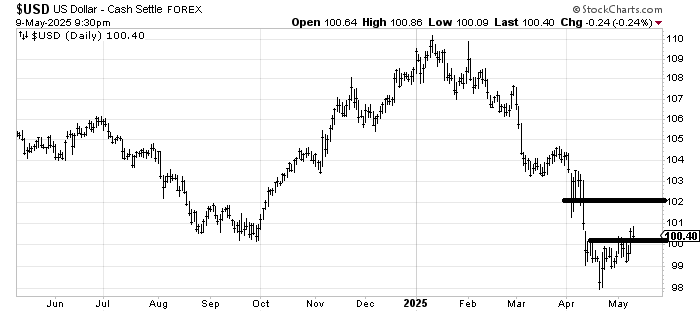
DXY. Got over 100. Can it hold it?
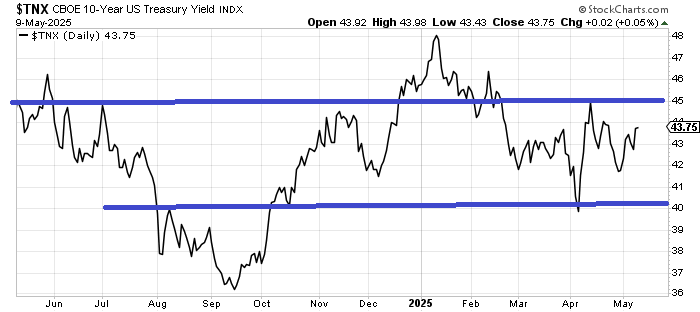
Bondaleros. Yield on 10 yr.
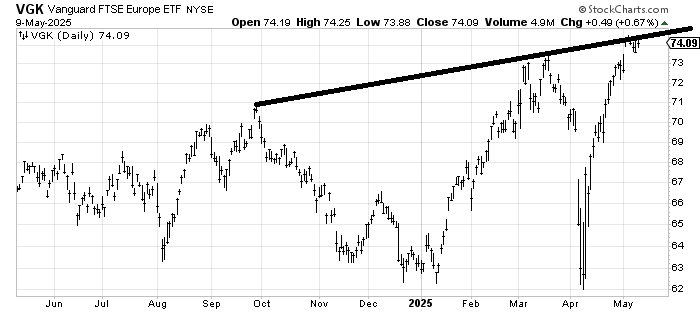
VGK
KWEB. Filled the gap.

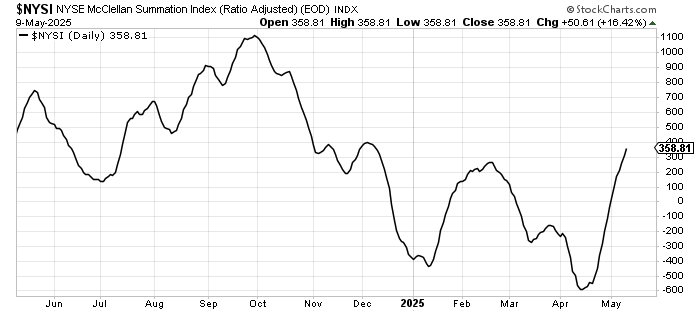
McClellan Summation Index. Still rising.
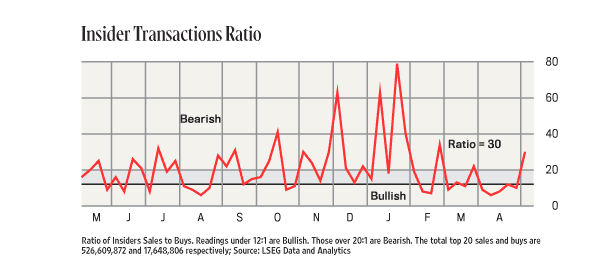
Insiders. Back to selling.
Citi Panic/Euphoria. Barely budged so it continues to sit just over the zero line.

Means nothing to me.
Too obvious… do not trust this head and shoulders… until it is too late.