


Saturday Chart Fest

Good Saturday Morning Chart Fans!
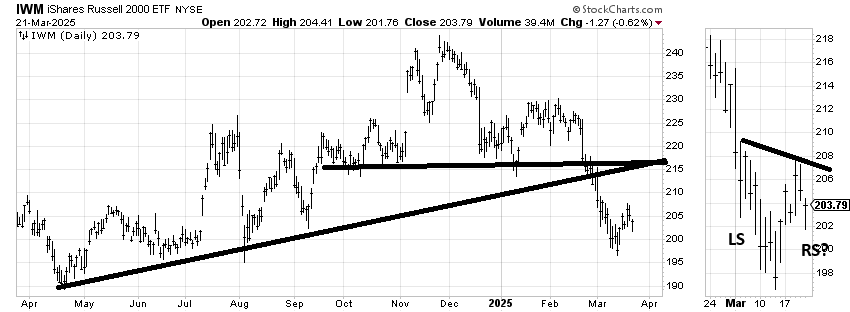
The charts haven’t changed much since last week but here’s a possibility for the bulls: on the IWM chart I have zoomed out the last few weeks of chop and there is a possibility of a very funky (and the CMTs out there will cringe for sure!) head and shoulders bottom. I’m not sure I trust it but if it were to pan out it measures right back to resistance.
I took this week’s charts back to Jan. 2024. I will return to one year charts next week.
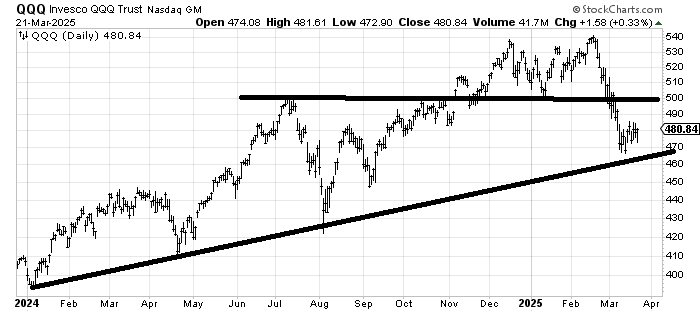
Apologies about last week’s QQQ chart. I edited it but it seems the edit didn’t take. Or took too long to take.
Dow

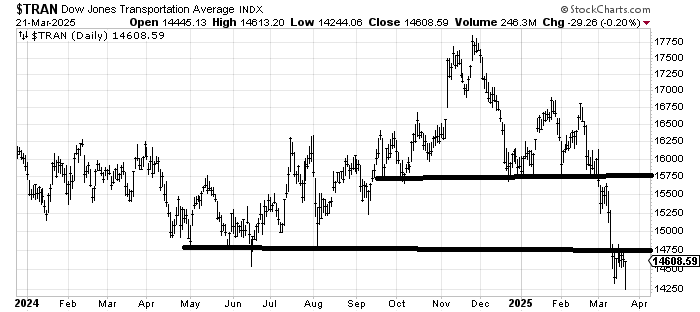
Transports
Utes

SPX. Blue and green lines are to show you the difference between ignoring the spike low in August (blue) or not (green).

Naz. I like the green line because it is flatter.

IWM. Yes I know the RS would be lower than the LS. As I said funky.
QQQ
QQQJ

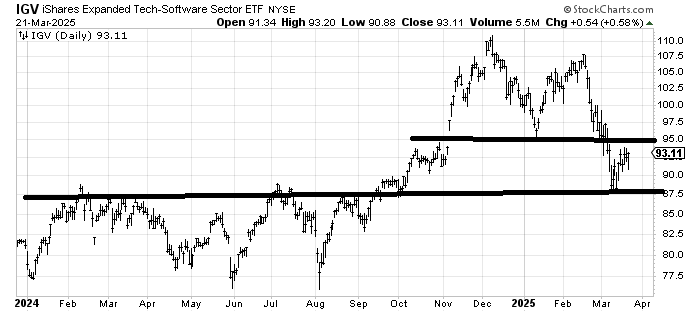
IGV
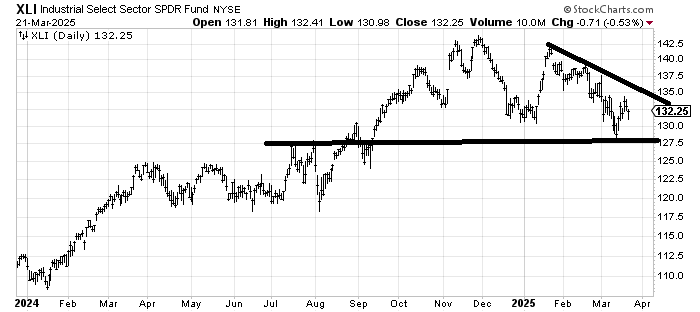
XLI
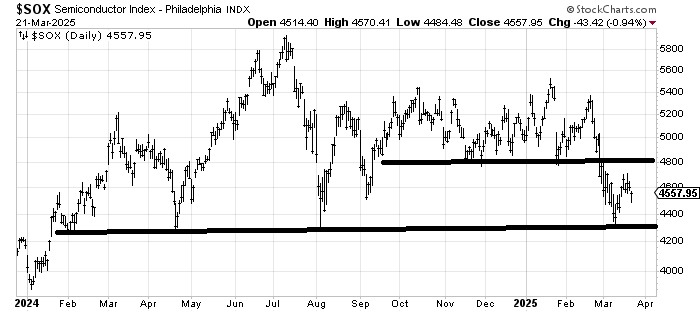
SOX
Bank Index.

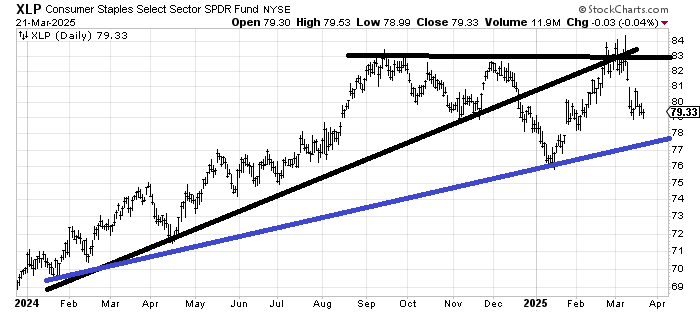
XLP
XLV

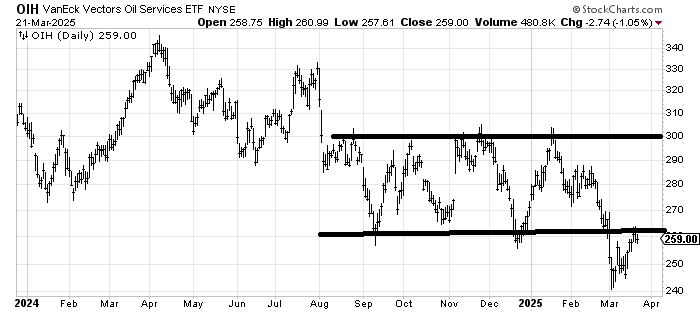
XLE. Has far outperformed its higher beta cousin OIH.

OIH
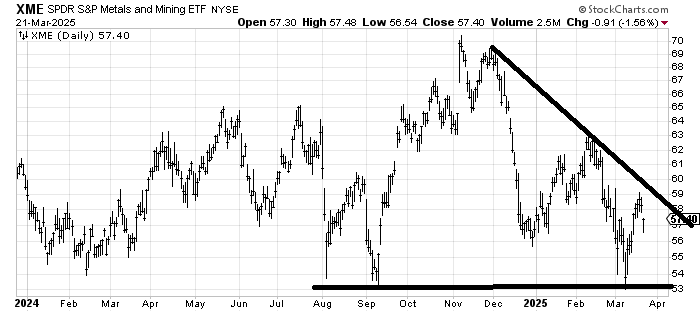
XME
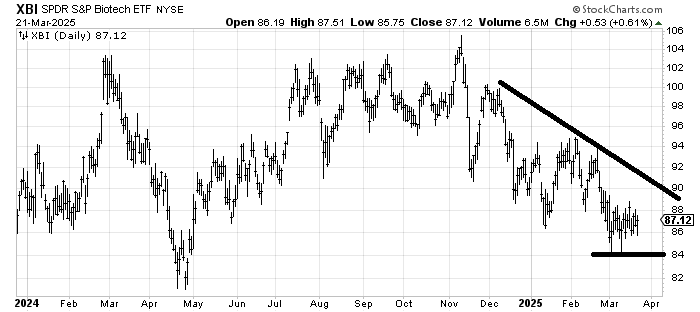
XBI
URA

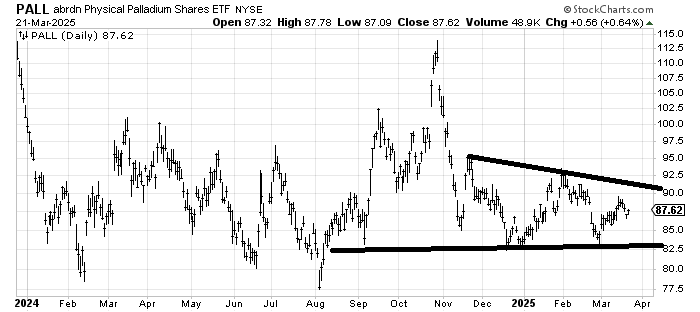
PALL
LIT

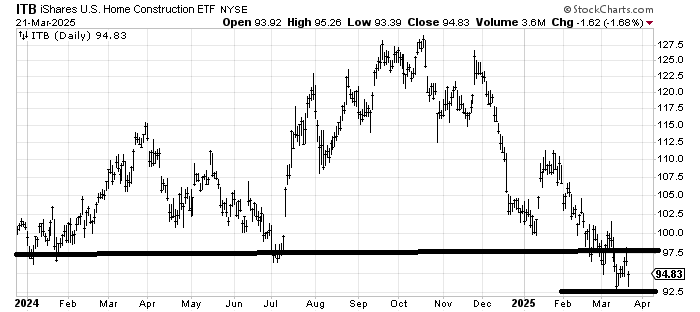
ITB. Failure to get over 98/100 is a problem.
IYR. Note they have finally gotten to this one.

GLD. This, Europe and China have stalled out in the last week.

VGK.

KWEB

DXY. 106 will continue to be the level I watch.

Bondaleros. Yield on the 10 yr. Big fat nothingburger in March.

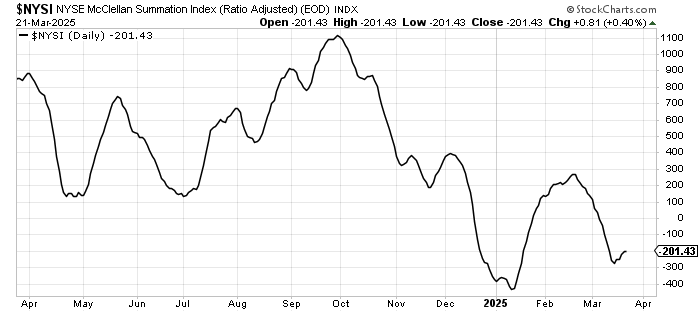
McClellan Summation Index. At least it hasn’t turned back down.
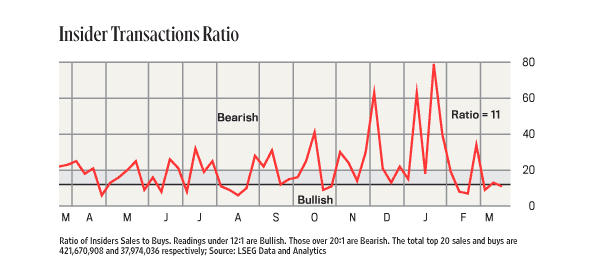
Insiders. At least they have stopped selling.
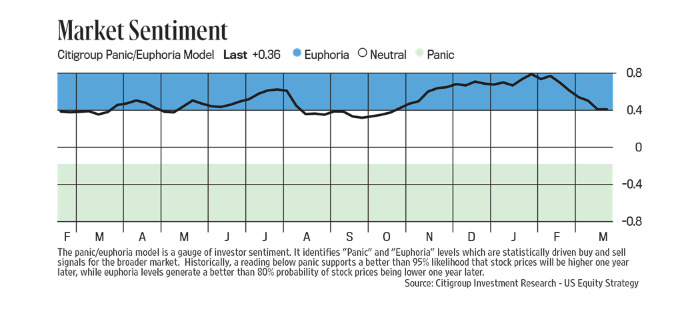
Citi Panic/Euphoria. Squint hard, get the magnifying glass so you can see it because it’s finally come down to the bottom of Euphoria for the first time since October.
Lastly, I chatted with Business Insider this week if you want to have a look. https://www.businessinsider.com/stock-market-correction-charts-what-happens-next-outlook-helene-meisler-2025-3
Comment of the week - “XLE. Has far outperformed its higher beta cousin OIH.” Thank you so much! Helene
PALL looks like a chopfest from hell it seems. Curious as to why PALL and not SPPP? Both platinum and palladium seem to get folks excited for a few days and then ultimately disappoint